
- Module that this feature covers
- What this feature is for
- Adding ranges in the Results Program
- Addinc specific ranges in the Rresults Program
- Analyzing Panel's Score compared to the defined ranges
Module that this feature covers
 Individual Performance
What this feature is for
The definition of ranges for a Results Program is interesting when it is desired to create scores equivalent to certain percentages of achievements, of the metrics that make up that Program.
It is common, for example, in a salary bonus program for a certain company, that it be defined that, based on a certain percentage of achievement of an Indicator, this metric has a certain score value. This score, together with the composition of other scores of the respective contracted metrics, will contribute to the final result of a Panel.
The definition of ranges makes it possible to make an assertive analysis about in which context the score of a metric is found, in relation to the regions of scores defined for the Results Program.
Adding ranges in the Results Program
Go to Settings and on the General tab, click on Management Plans. After that, click on the Management Plan you want to add the banner
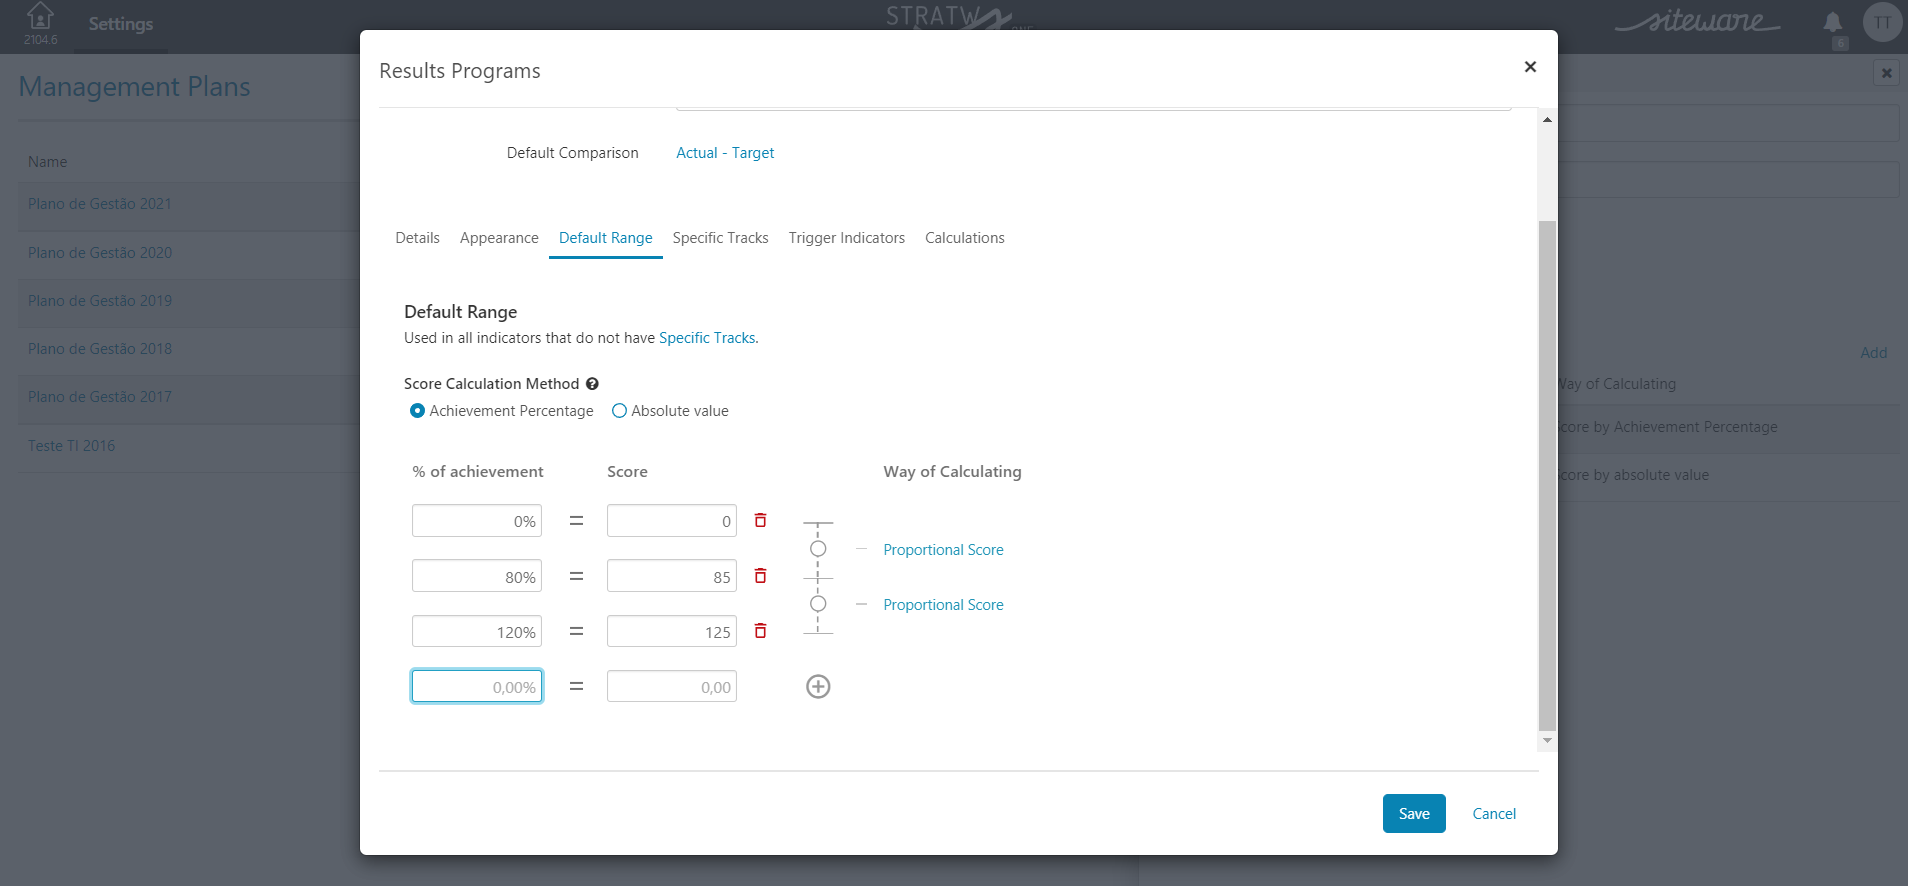
Access the Result Programs tab and click on the program you want. Then, look for the Default Range tab. On this tab there is the option Score Calculation Method, this option is intended to specify how each score in the range will be calculated. Achievement Percentage, associates the performance percentage to a score and Absolute value, associates the result of the indicator, in absolute value, to a score.
After adding all the scores you want, go to the Way of Calculating column. This option is where the calculation of the score between the defined percentage ranges will be defined.
There are three types of calculation method: Proportional Score, Maximum Score and Minimum Score.
Proportional score: all percentages or results achieved reached in this range will have their score calculation done proportionally.
- For example: a Proportional Grade is defined between the ranges of 10% and 20%. If the metric reaches 15%, the grade will be calculated proportionally within this range.
Maximum Score: for all percentages or results achieved reached in this range, the highest score between the two will prevail.
- For example: If a maximum score is defined between the ranges of 10% and 20%, if the metric reaches 15%, the highest note in this range, which is 20%, will prevail.
Minimum score: for all percentages or results achieved reached in this range, the lowest score between the two will prevail.
- For example: If a minimum grade is defined between the ranges of 10% and 20%, if the metric reaches 15%, the lowest grade in this range, which is 10%, will prevail.
Adding specific tracks in the Results Program
The specific ranges help to define a group of indicators with scores that work differently from the range previously established.
After defining the ranges and their calculation method, go to Specific tracks. Click on the Add tracks to specific indicators and define a name for the indicator group.
After that, click on the icon  . Then, look for the indicators you want and click on them. After defining the indicators, at the bottom, define Score Calculation Method and the ranges you want as an exception for them. It is also possible to define the way of calculation for this ranges.
After setting everything, click save.

Analyzing Panel's Score compared to the defined ranges
After defining the ranges for a Results Program, access a Panel of this Program that has metrics that have posted values.
On the Dashboard, define a period for analysis and note the value in the Score column for each metric there. Click on any of these values and then an interface will be shown showing all the range points defined for this Results Program, as well as the respective Results expected to reach each of these points.
Notice that, between each Range point interval, there is a graphical representation for the calculation method chosen for it. For minimum score range range, there is an arrow pointing to the range point located to the left of this range, while for the maximum score range, there is an arrow pointing to the right range point.
For a range interval configured for proportional score calculation, there is a dotted line. Thus, if the metric score is in this range, it will be proportionally located according to the range points at the end of this range.
For example, there is a Results Program configured with the following range points:
When accessing a Panel, note that there is a metric with the score value as 105. When you click on this score, note that it will be in the range of ranges corresponding to this note.

Because this interval is configured with the Proportional Score calculation formula, this note will be proportionally located between points 85 and 125.
In another metric, score 0 is displayed. When you click on it, we see that it is in the range defined by Minimum Score.
As this metric performed less than 80%, the Minimum Score was defined, set to 0.
If you have questions, remember that our Contents section has articles on various features of STRATWs One.
Feel free to consult and follow the ones you prefer! In addition, on our blog we produce various materials regarding management methodologies, productivity tips.
Visit https://www.siteware.com.br/blog/ and stay inside!
Comments
0 comments
Article is closed for comments.