
Modules that this feature covers
 Individual Performance
What this feature is for
The new Table view allows to simultaneously analyze all the monthly values of the Items that make up the Results Program’s Panels, without the need to navigate between the occurrences.
Changing the Dashboard view
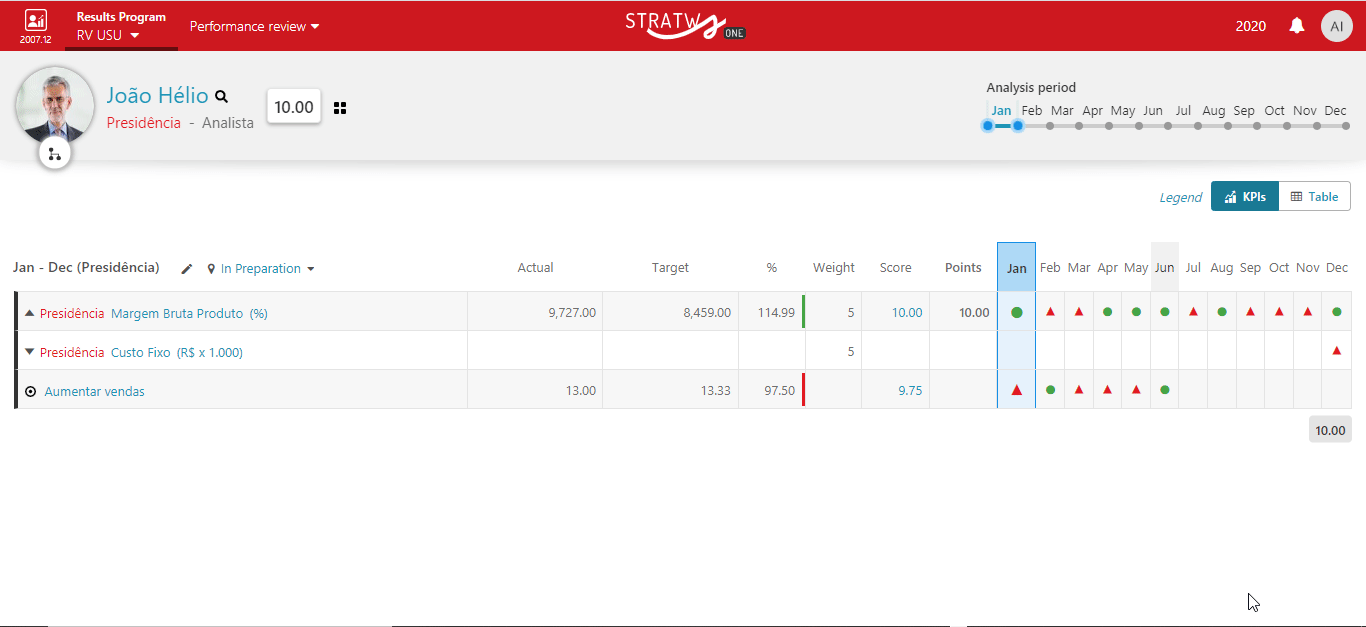
The available views are KPIs and Table:

KPIs: displays the information of ‘Actual’, ‘Target’, ‘%’, ‘Weight’, ‘Score’, ‘Points’ and the headlights for each occurrence. In this mode, you have to select the desired occurrence to analyze your data.
The ‘KPIs’ view is the standard one. That is, it will always be loaded when accessing the Results Program’s Panel.
To apply this view, when it is not selected, just select the KPIs option:
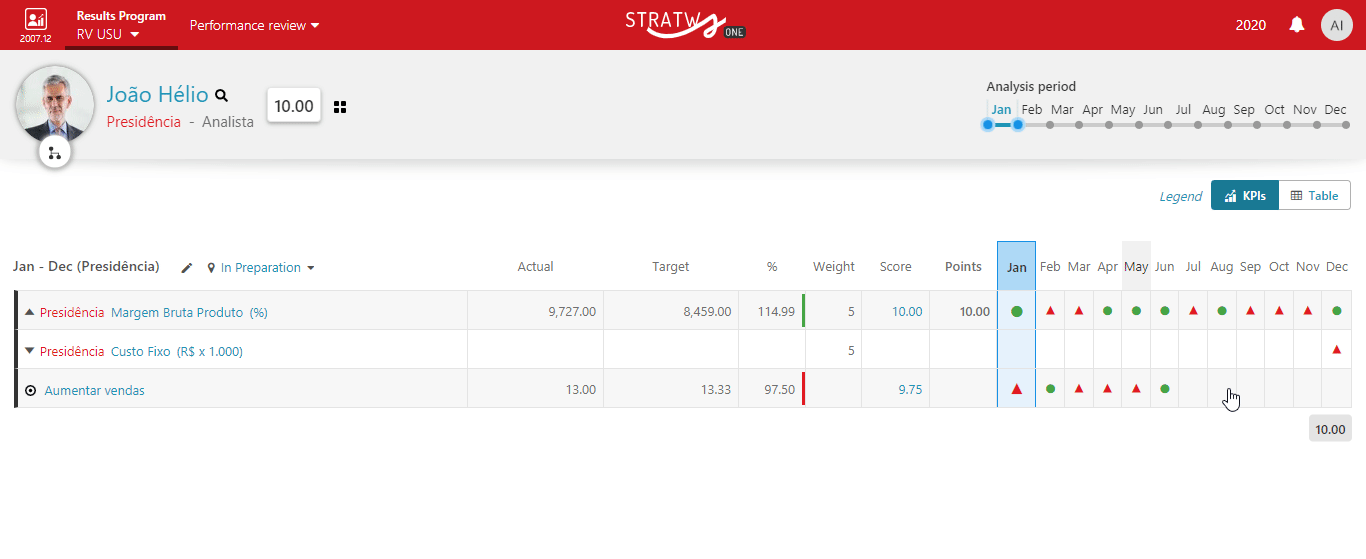
Table: displays the ‘Actual’’ and ‘Target’ values for all months, simultaneously, for all metrics contracted for the Panel. It also allows you to view ‘Performance’ by placing the mouse over ‘%’ on the desired occurrence.
To apply this view, simply select the Table option:
Comments
0 comments
Article is closed for comments.